At Gislen Software, we understand that performance isn’t just about speed. It’s about reliability, resilience, and being truly ready for real-world conditions.
This matters most when building systems for clients whose staff work out in the field – often in far-from-ideal environments. We’re talking about places with unreliable internet, weak mobile coverage, and work happening in lifts, basements, or remote locations. In these situations, applications must continue to function smoothly, even if the connection is dropped or lost entirely.
We faced a similar challenge in a recent project for a Swedish company. Their inspectors operate in all sorts of buildings – from new construction sites to old infrastructure – often in areas with little or no mobile signal. Sometimes, they’re even underground or inside shafts, where there is no connectivity at all.
In these scenarios, features such as offline support, reliable syncing, and a seamless user experience during connectivity loss aren’t optional – they’re absolutely essential. So, we needed a way to simulate, test, and refine how our system would behave under these challenging conditions.
To address these challenges, we turned to Grafana K6.
The Challenge: Reliable Performance in Unreliable Environments
It’s relatively easy to build and test a system that works well in perfect conditions – when the internet is fast and stable and traffic is light. But that’s rarely the case in the real world, especially for field-based users. In this project, the system had to support users who:
- Upload inspection reports and images from mobile devices
- Sync data at irregular intervals, depending on network strength
- Continue working even with little or no signal, including graceful error handling and data persistence.
Standard functional testing doesn’t reveal how a system behaves when 50 inspectors sync data simultaneously – some on fast 5G, others struggling with a poor 2G signal. What happens if uploads are interrupted midway? Or delayed for hours?
To answer these questions, we needed a performance testing tool that could replicate these real-life scenarios repeatably and reliably.
Our Solution – Using Grafana K6 for Realistic Load Testing
Grafana K6 is an open-source performance testing tool designed with developers in mind. Instead of using drag-and-drop interfaces, you can use JavaScript to define test cases, making it perfect for creating flexible and maintainable test scripts. Even better, K6 integrates well with DevOps pipelines and can export data to Grafana dashboards, which gives deep visibility into system behaviour during test runs. By using K6, we were able to simulate load scenarios that:
- Emulated real-time API calls from multiple users
- Added delays, timeouts, and retries to mimic poor network conditions
- Allowed us to monitor how each part of the system responded under pressure
How We Used K6 in Practice
We began by mapping typical workflows for inspectors:
- Logging into the system
- Uploading images and form data
- Syncing incomplete inspection reports
- Managing retries and partial syncs from broken connections

We wrote test scripts using JavaScript to simulate these actions. Then, we ran them via the command line and configured them to simulate various network conditions, including fluctuating latency, limited bandwidth, and so on. We integrated K6 into our CI/CD pipeline, which means that performance tests run with every build. This helped identify performance issues early, before they reached production.
Visualizing the Results with Grafana
For visibility, we connected K6 to Grafana dashboards so our team, including non-developers could monitor:
- API request volume (throughput)
- Response times (latency)
- Error rates and timeout incidents
- Backend resource usage (memory and CPU)

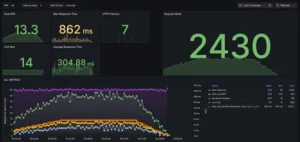
This dashboard presents performance metrics from a load test:
- Peak RPS (Requests per Second): 13.3
- Max Response Time: 1.12 seconds
- HTTP Failures: No data reported
- Requests Made: 2539 total
- Average Response Time: 382.27 ms
- Max Virtual Users (VUs): 15
The bottom section shows a time series of key metrics like RPS, iterations, VUs, and response times. All metrics peak around the same time and decline gradually.

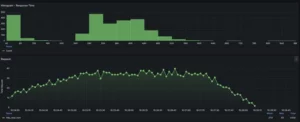
Response Time and Request Trend
- Top Chart (Histogram – Response Time): A histogram displaying the distribution of response times. Most responses fall within 60–480 ms, with a few outliers extending up to ~1100 ms.
- Bottom Chart (Request Trend Over Time): A line chart showing the number of HTTP requests over time. The request count peaks around 12:48 and then gradually declines.
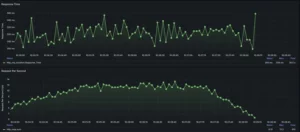
This image shows two focused line charts:
- Top chart (Response Time): Displays fluctuating HTTP response times, averaging around 382 ms with spikes up to ~495 ms.
- Bottom chart (Requests per Second): Indicates a rise and fall pattern in RPS, peaking at 13.3 RPS, matching the peak shown in Image 1.
These graphs help monitor performance trends and load behaviour in real time.


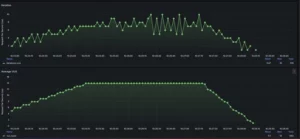
HTTP Request Summary Table
- Top Section (HTTP Request Stats): A table summarizing two POST requests:
- Both returned HTTP 200 (success).
- The first had higher response times, with a 95th percentile (P95) of 791 ms.
- The second performed better, with P95 at 143 ms.
- Bottom Section (Error Detail): No errors were reported during the test.
This helped us make data-driven decisions rather than relying on gut feelings. We clearly identified which parts of the system needed improvement and could track progress over time.
What Worked Well
Using K6 offered several benefits:
- Developer-friendly scripting: JavaScript made it easy to version control and reuse test logic
- Smooth CI/CD integration: Tests became part of the regular development workflow.
- Real-time and historical visibility: Grafana dashboards allowed detailed system monitoring and performance comparison between builds.
- Threshold alerts: We set rules, such as “95% of requests must respond in under 500ms,” and receive alerts when these thresholds are breached.
- Ideal for API-based systems: As our system relied heavily on REST APIs, K6 was a perfect match for stress-testing them.
A Few Limitations
K6 is surely powerful, but it still has a few trade-offs:
- No graphical interface: Test cases must be written in JavaScript code, which may be a challenge for non-technical team members.
- Limited UI testing: K6 works on the network/API level. For testing user interfaces, tools like Selenium or Playwright may be more suitable.
- Grafana setup required: You’ll need to configure Grafana if you haven’t already done so. But the benefits are well worth the effort.
The Outcome
Grafana K6 gave us a huge advantage. We could test how our system behaves under realistic field conditions – such as delayed uploads, dropped signals, and large image files – and make improvements accordingly. Here are a few key results:
- Improved our upload retry system to better handle dropped connections
- Optimised slow database queries to improve response times under heavy load
- Detected and resolved memory issues that could’ve caused long-term performance degradation
The final system wasn’t just fast in ideal conditions – it was stable, efficient, and user-friendly even in difficult, real-world environments.
Final Takeaway
If you’re building software for people who work on the move, such as those in construction, inspections, healthcare, logistics, or remote areas, performance testing is critical. Functionality alone won’t cut it. Users need systems that work reliably, whether they’re in an office or halfway down a lift shaft.
Grafana K6 helped us simulate and prepare for the messy realities our users face so we could deliver a system that our client (and their inspectors) can truly trust.
Curious how performance testing could improve your systems?
Let’s talk – we’d be happy to share our experience and approach.

